Scala CLIにはJava Microbenchmark Harness (JMH)を使ったベンチマークを取るための機能がある。JMHでは、いくつかのアノテーションをつけてプログラムを起動することで、自動的にパラメータを調整したベンチマークを実行してくれる。ベンチマークはメソッド単位の小規模(Microbenchmarkの名前はここに由来する)で行なわれ、スループットなどを計算してくれる。
この記事では、JMHを利用したベンチマーク作成の初歩と、これをScala CLIで実行する方法について説明する。
Scala CLI
今回利用したScala CLIのバージョンは以下の通り。
% scala-cli version
Scala CLI version: 1.0.4
Scala version (default): 3.3.0
Scala CLIがインストールされていない場合は、Coursierを使ってインストールできる:
% cs install scala-cli
もしくは、以下のページに行くことでScala CLIのインストールに必要なスクリプトを実行できる:
ベンチマーク
今回は、各種コレクションに対してmap操作を行う場合のスループットについて計測してみようと思う。条件は以下の通りとする。
Array,List,Vectorに対してベンチマークする- 内容物は
Intとする _.map(_ * 2)するための所要時間を集計する- コレクションのサイズを10 / 1000 / 10000 / 1000000に順に切り替えてベンチマークする
Scalaソースコードの用意
Scala CLIでJMHによるベンチマークを行う場合は、.scalaファイルで保存しなければならない。.scala.scでは正しく動作しないので注意する。
加えて、パッケージ指定が必須であったり、ベンチマークパラメータに使う変数の型アノテーションが必須になるなど、少々気をつけるべき箇所がある。
//> using scala 3.3.0

// 適当な名前でパッケージを切る必要がある
package bench

// JMHが利用するアノテーションをインポートする
import org.openjdk.jmh.annotations._
import java.util.concurrent.TimeUnit

// クラスに格納しなければ正しく動作しないのでクラスにする

@State(Scope.Benchmark)
// 出力の時間フォーマットにはmsを使うという指定
@OutputTimeUnit(TimeUnit.MILLISECONDS)
// スループットを測定してほしいという指定
@BenchmarkMode(Array(Mode.Throughput))
// 各測定はウォームアップのために2回、本番で1回とする
@Fork(value = 1, warmups = 2)
// ウォームアップのために1回
// iterationsは数値測定の回数を、timeは1回のイテレーションに使う時間を指定する
@Warmup(iterations = 1, time = 100, timeUnit = TimeUnit.MILLISECONDS)
@Measurement(iterations = 10, time = 100, timeUnit = TimeUnit.MILLISECONDS)
class BenchMap {
  var arr: Array[Int] = null
  var lis: List[Int] = null
  var vec: Vector[Int] = null

  // ベンチマークの試行ごとに変化させる要素には@Paramアノテーションを行い、文字列のArrayを渡す
  // : Intの型アノテーションは必須
  @Param(Array("10", "1000", "10000", "1000000"))
  var len: Int = 0

  // 試行ごとの初回のセットアップ時に実行される初期化様メソッドには@Setupアノテーションを付与する
  @Setup
  def setup: Unit =
    arr = (1 to len).toArray
    lis = (1 to len).toList
    vec = (1 to len).toVector

  // @Benchmarkをつけたメソッドがベンチマーク対象として繰り返し実行される
  @Benchmark
  def benchArr = arr.map((n: Int) => n * 42)

  @Benchmark
  def benchLis = lis.map((n: Int) => n * 42)

  @Benchmark
  def benchVec = vec.map((n: Int) => n * 42)
}
ベンチマークを行うには、scala-cli --power --jmhを実行する:
% scala-cli --power --jmh jmh-map.scala
...
# Run progress: 98.33% complete, ETA 00:00:00
# Fork: 5 of 5
# Warmup Iteration   1: 0.017 ops/ms
Iteration   1: 0.023 ops/ms
Iteration   2: 0.128 ops/ms
Iteration   3: 0.110 ops/ms
Iteration   4: 0.132 ops/ms
Iteration   5: 0.128 ops/ms
Iteration   6: 0.122 ops/ms
Iteration   7: 0.129 ops/ms
Iteration   8: 0.126 ops/ms
Iteration   9: 0.128 ops/ms
Iteration  10: 0.128 ops/ms


Result "bench.BenchMap.benchVec":
  0.117 ±(99.9%) 0.015 ops/ms [Average]
  (min, avg, max) = (0.018, 0.117, 0.142), stdev = 0.030
  CI (99.9%): [0.102, 0.132] (assumes normal distribution)


# Run complete. Total time: 00:00:58

REMEMBER: The numbers below are just data. To gain reusable insights, you need to follow up on
why the numbers are the way they are. Use profilers (see -prof, -lprof), design factorial
experiments, perform baseline and negative tests that provide experimental control, make sure
the benchmarking environment is safe on JVM/OS/HW level, ask for reviews from the domain experts.
Do not assume the numbers tell you what you want them to tell.

Benchmark            (len)   Mode  Cnt      Score      Error   Units
BenchMap.benchArr       10  thrpt   50  43597.739 ± 3340.313  ops/ms
BenchMap.benchArr     1000  thrpt   50    381.018 ±   28.369  ops/ms
BenchMap.benchArr    10000  thrpt   50     34.665 ±    2.925  ops/ms
BenchMap.benchArr  1000000  thrpt   50      0.348 ±    0.027  ops/ms
BenchMap.benchLis       10  thrpt   50  16106.010 ± 1256.862  ops/ms
BenchMap.benchLis     1000  thrpt   50    160.354 ±   14.797  ops/ms
BenchMap.benchLis    10000  thrpt   50     16.595 ±    1.463  ops/ms
BenchMap.benchLis  1000000  thrpt   50      0.076 ±    0.024  ops/ms
BenchMap.benchVec       10  thrpt   50  21653.059 ± 1929.930  ops/ms
BenchMap.benchVec     1000  thrpt   50    280.131 ±   21.659  ops/ms
BenchMap.benchVec    10000  thrpt   50     23.333 ±    3.449  ops/ms
BenchMap.benchVec  1000000  thrpt   50      0.117 ±    0.015  ops/ms
Arrayはやっぱり速いねぇ
パラメータの設定
パラメータや設定が多くて所要時間を予測しづらいので、早見表を作った。
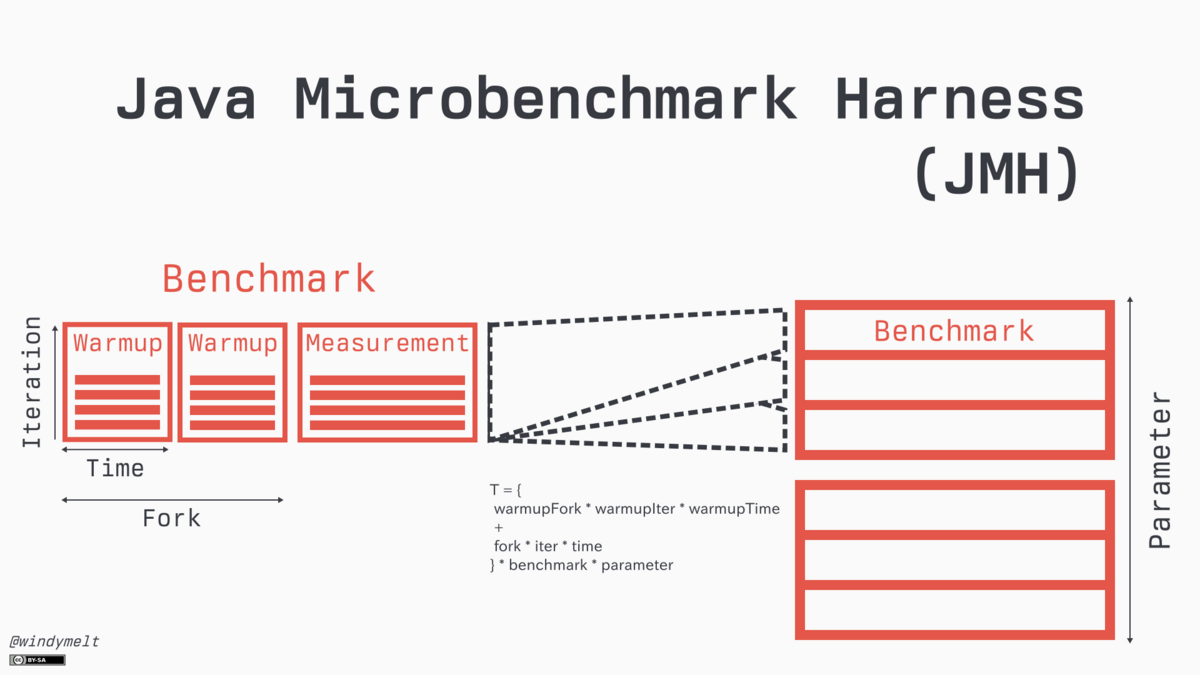
厳密には表ではないが、まあいいか。
参考文献
この記事では、sbtを使って同様のベンチマークを作成している。